Permanent Energy Metering: What Branch-Circuit Data Can Reveal
Permanent energy metering is an installed system of meters or sensors at named electrical boundaries. It preserves power and energy records through time so a site total can be compared with selected feeders and branches.
The useful evidence comes from the full monitoring chain: measurement point, sensor, clock, communications, storage, stable naming and an export the owner can still use later.
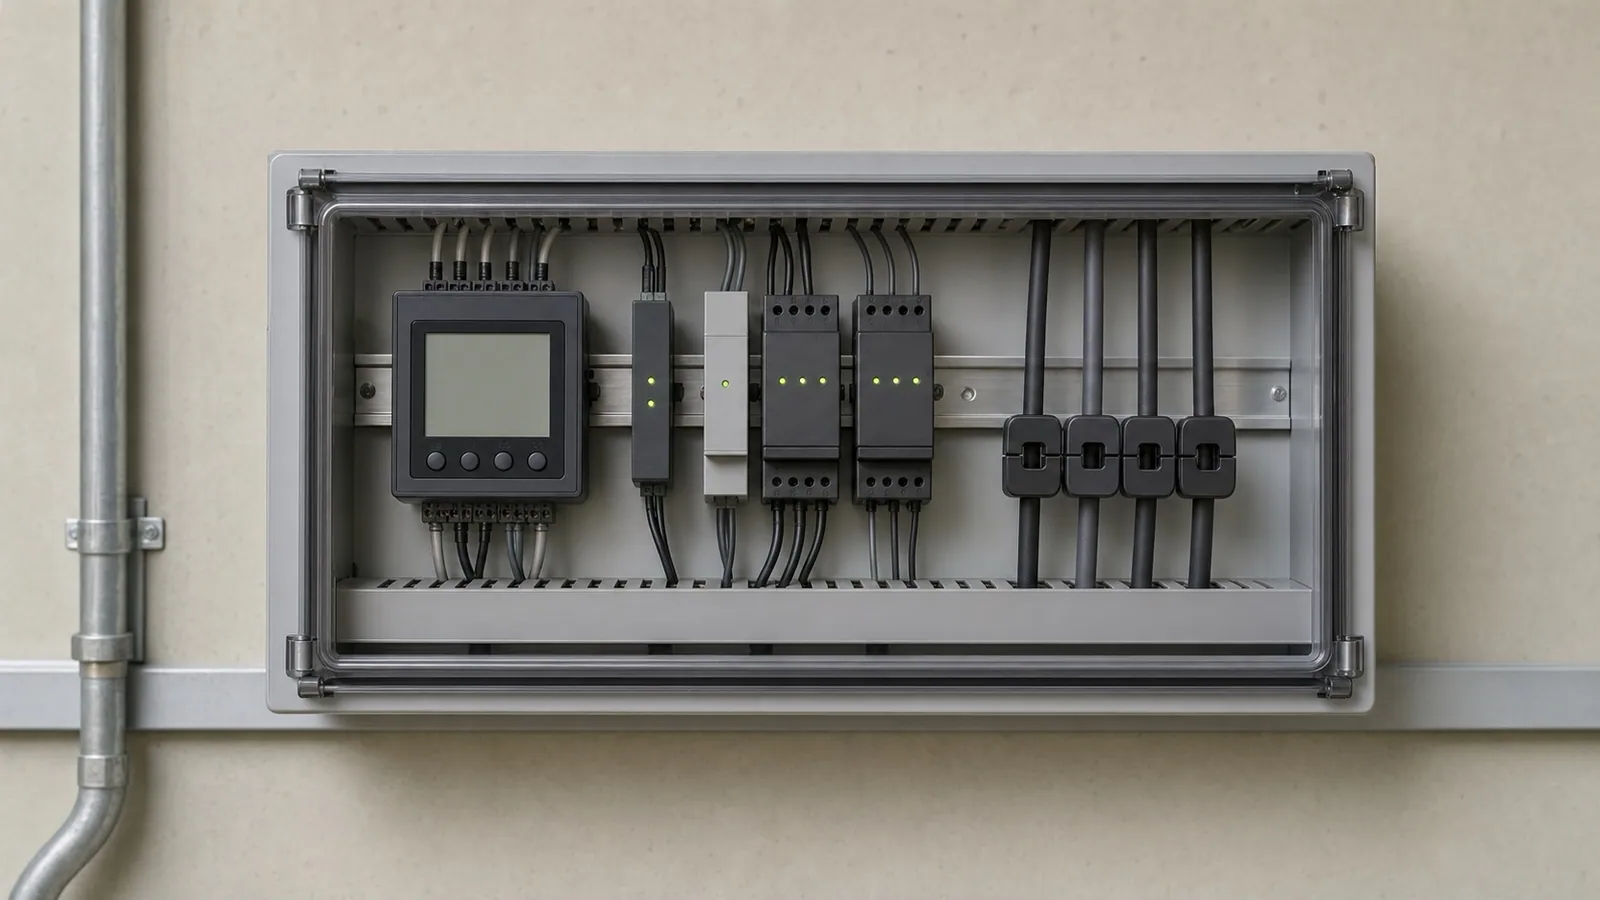
Fixed measurement points turn a site total into a record of named uses.
A permanent meter stays associated with the same electrical boundary. Its record may include active power in kilowatts, accumulated energy in kilowatt-hours, demand, current, voltage and model-dependent network quantities. Stable point names and timestamps make those records comparable from one period to another.
Utility or revenue meter
Records the supplier or contractual boundary. Available interval detail and owner export access vary.
Useful for the account total; it rarely explains which internal branch changed.
Temporary load logger
Moves to a selected point for a defined campaign and operating question.
Useful when the site needs a temporary demand profile before committing to installed coverage.
Permanent site metering
Keeps named points available for continuous baselines, allocation, recurring review and verification.
Useful when the monitoring question will remain after one campaign ends.
Individual models can overlap. IEC 61557-12 covers power metering and monitoring devices used in electrical distribution, while electricity-metering and dedicated power-quality instruments sit under different requirements. The intended evidence and use determine the applicable device and method. IEC 61557-12:2018
The meter is one part of the monitoring chain.
Each selected boundary combines a current transformer or another compatible sensor with a power and energy meter. The sensor follows the conductor; the meter combines that signal with its voltage reference to produce named, time-stamped quantities. The solid routes below identify the electrical boundaries. The dashed routes follow the stored records through the gateway, local buffer and owner export.
Measurement point
A named electrical boundary on the one-line diagram, such as the incomer, shared cooling feeder or food-service distribution board.
Meter and sensors
The device measures the selected electrical quantities. Current transformers or other sensors may be separate from the meter body.
Shared time base
A synchronized clock lets site total, branch records and operating events be compared over the same interval.
Gateway and communications
The communications layer collects records from the meters and transfers them through the selected local or network path.
Storage and export
Local buffering, platform retention and an accessible raw export keep the record useful during outages and after software changes.
Point naming
Stable names connect each data series to the same physical boundary in reports, dashboards and future maintenance records.
This conceptual monitoring map is limited to data roles and electrical boundaries. Terminal connections are intentionally omitted. Equipment selection, installation and commissioning belong to qualified personnel using the approved design, manufacturer instructions and site controls.
A useful reconciliation explains the site total and the part that remains unallocated.
Power in kilowatts describes the rate of use at a moment or interval. Energy in kilowatt-hours accumulates that use through time. Monitoring software commonly presents accumulated energy as a consumption breakdown. In this illustrative week, the stacked bar shows how the site-reference total is distributed among named branches over the same seven-day period; the hatched segment is the part outside the selected branch scope.
What the comparison supports
The owner can see which named uses account for most of the recorded energy and whether a branch changed in the same period as the site total. A large branch alone does not establish inefficiency; occupancy, weather, production and service level still shape the baseline.
What the remainder means
Unallocated energy can reflect unmetered circuits, different interval boundaries, missing records, measurement uncertainty or a scope mismatch. The remainder needs investigation and does not establish loss or misuse.
Each point should answer a named management question.
The incomer establishes the reference. Major feeders explain the largest uses. Selective branch points are added where ownership, drift, control or verification requires finer evidence. Metering every final circuit can add cost and data volume without improving the decision.
Site reference
Main LV incomer
Total site demand and energy at the selected internal boundary.
Anchors reconciliation and shows whether the site total changed.
Major use
Shared cooling feeder
A large controllable use with its own operating schedule and baseline.
Reveals drift, off-hours operation and the result of control changes.
Responsibility boundary
Retail or food-service board
Consumption associated with a named tenant, department or service area.
Supports internal allocation and identifies where a follow-up should begin.
Selective branch
Kitchen plant or lift group
A narrower record added because a specific operating question requires it.
Avoids metering every circuit when only a few branches change the decision.
The site total rose; the branch record showed where the change was occurring.
Consider a mixed-use property with retail tenants, food service, lifts, common areas and shared cooling. Monthly consumption had increased, but tenant activity alone did not explain the change. Permanent meters at the site reference and major feeders allowed the same six weeks to be compared by use. Each column below is the energy accumulated during one comparable overnight window; the shaded band records the prior typical range for this example.
What the meters showed
Retail, food-service and common-area energy remained near their comparable pattern. Overnight cooling energy rose above its prior typical range for three weeks.
What inspection confirmed
The record directed the review to cooling controls and operating schedules. Qualified inspection found that an extended schedule remained active after an operating change.
How the change was verified
After the schedule was corrected, the same branch and overnight window returned to the prior range. The meter verified the measured result; it did not diagnose the control issue without the inspection.
All graph values and the worked case are illustrative. The shaded range belongs to this example and is not a universal target or acceptance limit.
The record becomes valuable when it changes where the site looks and how it verifies the result.
A meter cannot correct a schedule, inspect equipment or establish a physical cause. It can keep the relevant boundary visible long enough to target the next action and repeat the comparison afterward.
Locate a change within the site
Evidence: The site total rises while retail and common-area records remain stable; shared cooling rises in the same period.
Practical value: Inspection can begin at the cooling boundary instead of treating the whole property as one unknown load.
Maintain useful operating baselines
Evidence: Comparable night, weekday or occupied-period energy is preserved for the same named branch.
Practical value: A gradual drift becomes visible before it is hidden inside the monthly site total.
Support internal allocation
Evidence: Named meters separate tenant, department and common-service consumption with known gaps and boundaries.
Practical value: Owners can discuss consumption using a transparent internal record while confirming any separate billing requirements.
Prepare energy and capacity studies
Evidence: Long-term interval records show when major uses operate together and how demand changes across seasons.
Practical value: The data can strengthen solar, storage, efficiency and expansion studies alongside the other required design inputs.
Verify a change after implementation
Evidence: The same branch, interval and relevant operating condition are compared before and after a schedule, control or equipment change.
Practical value: The team can confirm whether the measured condition improved and whether the improvement persisted.
The working system includes sensors, communications and data access.
A small DIN meter can suit one branch. Main feeders may need CT-operated multifunction meters. Dense panels can favor multi-circuit acquisition. The exact model, sensors, gateway, software and license conditions determine the final capability.
Communicating DIN-rail energy meter
- Where it fits
- One direct-connected or CT-operated point where energy, power and a basic interval record are required.
- Complete architecture
- Meter, suitable communications and model-dependent onboard or upstream storage.
- Neutral examples
- Schneider PowerLogic iEM; comparable Circutor DIN families.
2,500–6,000 MAD per point
CT-operated multifunction meter
- Where it fits
- Main incomers and major feeders requiring a wider set of power, demand and model-dependent network quantities.
- Complete architecture
- Panel meter, compatible current transformers, voltage reference, communications and commissioning record.
- Neutral examples
- Schneider PowerLogic PM5000; Circutor CVM; Janitza UMG.
5,000–15,000+ MAD per point
Multi-circuit branch-monitoring architecture
- Where it fits
- Dense distribution boards where several named outgoing circuits need one coordinated measurement system.
- Complete architecture
- Voltage module, multi-channel current acquisition, sensors, interface or gateway, enclosure work and software layer.
- Neutral examples
- Schneider HDPM/BCPM; Socomec DIRIS Digiware; Janitza branch-monitoring families.
20,000–70,000+ MAD starter architecture
Gateway and platform layer
- Where it fits
- Sites that need aggregation, local buffering, alarms, remote access, dashboards or scheduled exports.
- Complete architecture
- Gateway, network path, storage, software or licenses, users, retention and an agreed data-exit route.
- Neutral examples
- Manufacturer and open-protocol integrations vary by selected meter family.
Specified with the architecture
July 2026 acquisition references. Rounded MAD equivalents use approximately 1 EUR = 10.71 MAD. VAT, import, transport, current transformers, gateway, enclosure work, communications, software, licenses, commissioning, calibration and professional analysis may be excluded. Hardware acquisition and ReneWave service scope are separate.
Examples are market references, not rankings. Capabilities vary by model and package: Schneider PowerLogic iEM, PM5000 and HDPM; Socomec DIRIS Digiware; Circutor CVM and multi-point families; Janitza UMG and branch-monitoring families.
Commissioning must prove that every series is named, synchronized and recoverable.
A plausible number on a dashboard is an incomplete handover. The dossier connects each series to a physical point, records the complete measurement chain, tests the shared clock, checks how gaps are handled and confirms that the owner can retrieve usable data.
Commissioning dossier
Six records keep the installed architecture understandable after the commissioning team leaves.
Purpose and boundaries
Management question, one-line reference, point names, quantities, intervals and the intended use of each record.
Installed measurement chain
Meter and sensor models, ratios, direction, accuracy or verification status, firmware and communication path.
Time and data continuity
Clock source, time zone, interval boundary, local buffer, retention, outage behavior, restoration and data-gap flags.
Validation
Plausible live values, phase association, directional flow, point naming and an initial comparison between site and branch totals.
Access and ownership
User roles, owner access, raw export format, software or license dependencies, retention and the exit plan if the platform changes.
Change control
Any renamed circuit, changed ratio, replaced meter, firmware update, clock correction or known gap is preserved with a date.
First useful review
Confirm that every named point reports plausible, time-aligned data, that the site and branch totals reconcile within the known scope, and that a communication interruption produces a visible gap or successful backfill. This validates the record. It does not establish the physical cause of an operating change.
The handover should survive a supplier, software or staff change.
A dashboard account alone does not document the architecture. The owner needs a point register, configuration record, raw export path, data-retention terms and a clear statement of the monitoring purpose and its limitations.
Metering register
Stable point name, physical location, one-line reference, purpose and responsible owner.
Configuration
Meter, sensor, ratio, direction, interval, clock, firmware, communications and validation record.
Data record
Retention, local buffer, known gaps, raw export format, platform access and recovery behavior.
Baseline method
Compared period, relevant operating conditions, exclusions and the reason the baseline is useful.
Interpretation
What changed at the measured boundary, confidence, unresolved physical cause and proposed follow-up.
Ownership and exit
Who can retrieve the data, which licenses are required and how records remain available after a supplier or platform change.
Six questions keep the architecture tied to its purpose.
Which management decision will each proposed measurement point support?
How do point names and meter locations match the current one-line diagram?
Which meter, sensor, ratio, interval and time source will be commissioned at each point?
What remains recorded locally if communications or internet access fails?
Can the owner retrieve raw interval data without losing names, timestamps or units?
Is the intended use operational monitoring, internal allocation or formal billing, and which requirements follow from that purpose?
Operational monitoring, internal allocation and formal billing are different purposes. Formal tenant billing requires the applicable metrology, legal, contractual and installation requirements to be confirmed. IEC 62053-22:2020
Questions that remain after the meters are selected.
Existing data, the number of useful points, billing intent and platform behavior can change the architecture. These answers define the boundaries that should be resolved before procurement.
What a credible permanent metering architecture makes possible.
Permanent metering can show where energy is being used, maintain a baseline for the same named boundary and reveal when a branch begins to drift from its previous operating pattern. That evidence lets an owner target inspection, operating review or an energy project with greater precision.
After a schedule, control or equipment change, the same record can verify whether energy, demand or off-hours operation improved and whether the result lasted. The meter identifies the measured boundary and timing; inspection and other tests establish the physical cause.
Reveal
Site total, named branch contribution, unallocated remainder, drift and recurring operating patterns.
Guide
Targeted inspection, operating changes, selective submetering and better-defined energy or capacity studies.
Verify
Comparable before-and-after records at the same boundary and under relevant operating conditions.
Preserve
Point names, configuration, time base, raw exports, data ownership, gaps and interpretation.
Have a metering architecture or data export to review?
Send the one-line diagram, bills, existing meter list, point register, sample export or monitoring proposal. ReneWave can explain which boundaries are visible, which data-chain details are missing and what the record can support.
