Power Quality Analysers What event logging can reveal
A power-quality analyser is a portable or fixed electrical instrument that records voltage and current through time, calculates supply-quality parameters and preserves disturbances for later analysis.
It is used when equipment resets, trips or behaves unpredictably and the electrical condition may have disappeared before a technician arrives. Its trends, event logs, waveforms and timestamps let the site compare an electrical change with what the equipment was doing at that moment.
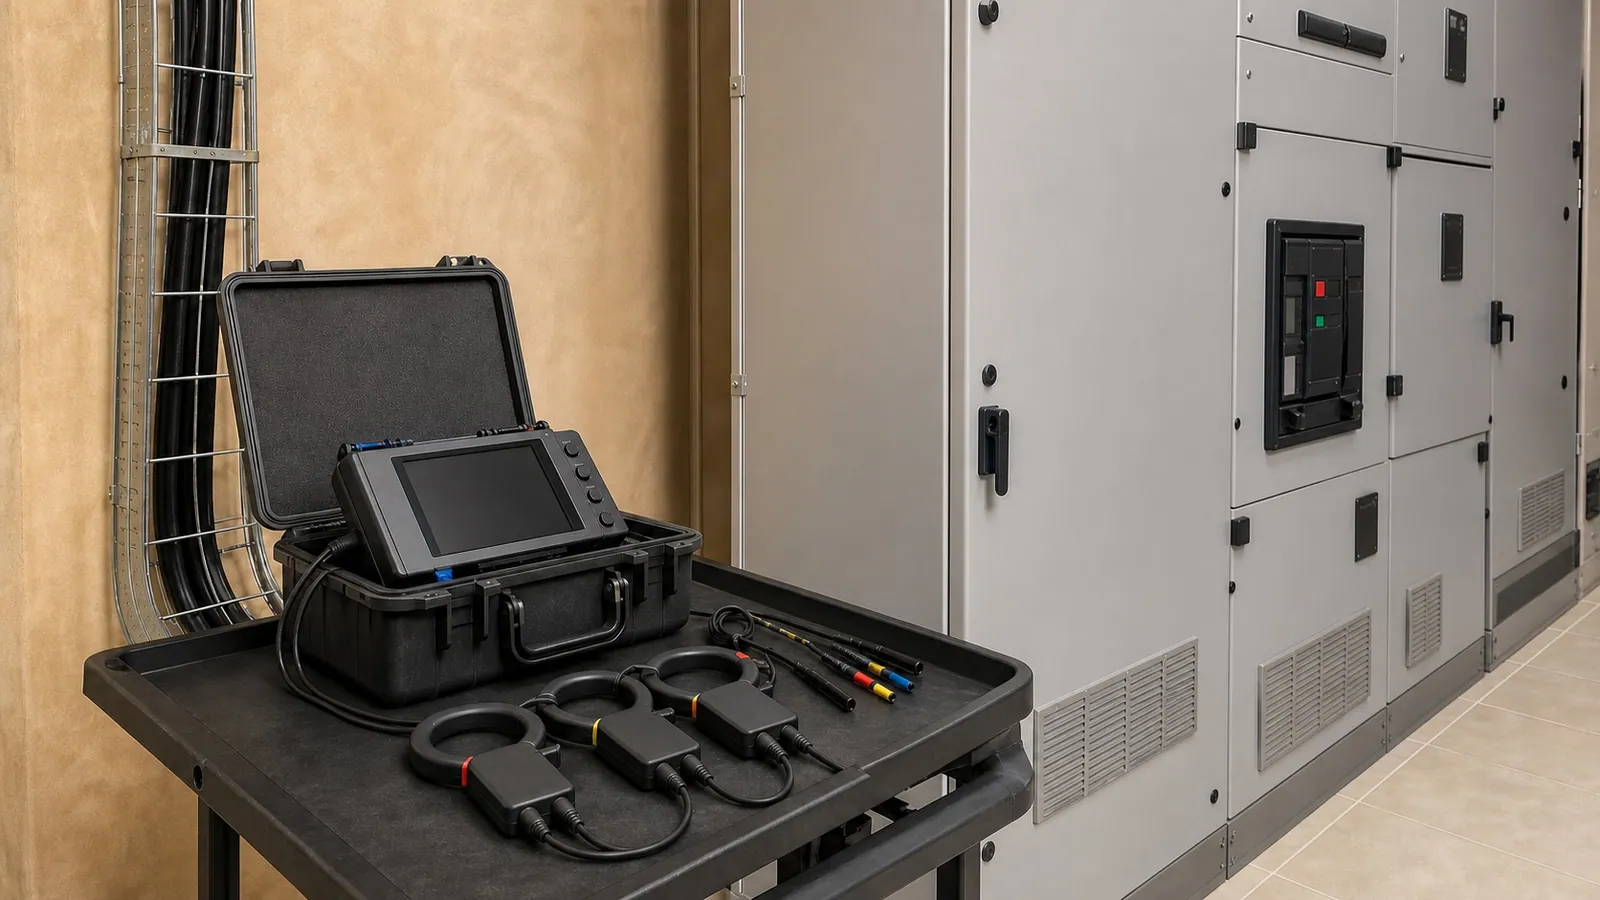
A power-quality analyser turns changing electrical conditions into a time record.
Qualified personnel use the analyser at a selected board, feeder or equipment boundary. The instrument follows voltage and current while the site operates, then calculates and stores the quantities configured for the investigation. Portable analysers support temporary campaigns; fixed instruments can provide continuous monitoring.
Instrument roles overlap and individual models vary. Their usual outputs explain why a power-quality campaign preserves a different record from a routine electrical reading.
Multimeter
A voltage, current, resistance or continuity reading taken during the visit.
A value tied to that measurement moment.
Clamp meter
Current and related electrical checks on a named circuit or load.
Spot readings; some models also provide limited logging.
Energy and load logger
Capacity, consumption, demand and energy-use questions across a named operating period.
Power, kWh, interval demand and load-profile information; event and waveform detail varies by model.
Power-quality analyser
Voltage quality, waveform condition and disturbances that occur through time.
Trends, event logs, timestamps, duration, affected phases, waveforms and harmonic summaries.
Rising demand or a planned expansion usually calls for a load profile. Resets, flicker, trips and suspected voltage events call for power-quality evidence. When both questions are present, confirm whether one advanced instrument and its complete sensor and software package can preserve both records, or coordinate the measurements.
Standardization context
2003 → 2025
IEC published the first edition of its standardized power-quality measurement methods in 2003. The fourth edition, published in 2025, covers current methods for conducted phenomena including voltage magnitude, dips, swells, interruptions, transients, unbalance, flicker, harmonics, interharmonics and current quantities. This history places the analyser inside a mature measurement discipline.
Four linked views turn a brief event into usable evidence.
The operating-day trend locates the marked event in time. The linked record preserves its timestamp and duration, while the waveform and harmonic views add detail about electrical shape and recurring distortion.
Illustrative values keep the focus on how the record is read. Each view identifies its lines, axes and markers and the decision that evidence can support.
Illustrative analyser record
Follow the event from top to bottom. The trend locates the change in time. The linked event row names it. The waveform and harmonic views add electrical detail for the reviewer.
01 · Voltage trend
Supply voltage across the operating day
The three lines represent the three supply phases. Their downward movement marks a temporary voltage reduction; the vertical marker identifies the moment saved in the event log.
02 · Linked event record
Timestamp
14:22:18.420
The saved moment
Event type
Voltage sag
A temporary reduction
Duration
0.41 seconds
How long it persisted
Affected supply
All three phases
Technical notation: L1 · L2 · L3
03 · Waveform view
Electrical shape around the event
Time runs left to right. Wave height represents voltage magnitude. The smaller wave illustrates the lower voltage during the sag.
04 · Harmonic spectrum
Repeating components inside the waveform
The first bar represents the fundamental supply frequency. The 3rd, 5th and 7th bars are selected repeating frequency components. Taller bars indicate a stronger relative contribution in this illustrative view.
For an intermittent reset, the event log locates the moment, the trend provides the surrounding operating period, and the waveform or harmonic detail directs the next technical review. A credible handover preserves these views with the measurement point and configuration that produced them.
Different electrical problems leave different patterns.
An operator may first notice a reset, dimming light, alarm or unusual motor behavior. The analyser organizes the electrical evidence into voltage-level changes, waveform-shape changes, and phase or repeated variation so the investigation can follow the pattern that matches the symptom.
Related phenomena are grouped by the part of the record that changes. A dashed line provides a simple reference, the solid line shows the illustrated condition, and time moves from left to right.
Voltage level through time
These records show whether supply voltage fell, rose or disappeared during an operating event.
They help connect resets, contactor releases, transfer events or lighting changes to a measured voltage condition.
Voltage sag
Supply voltage falls briefly and then recovers.
What the record can support
Check the depth, duration, affected phases and timestamp against the equipment symptom.
Voltage swell
Supply voltage rises briefly before returning.
What the record can support
Compare the peak and duration with overvoltage alarms, switching records or process changes.
Interruption
Voltage disappears or falls close to zero for a recorded interval.
What the record can support
Use the start, duration and recovery record to investigate simultaneous stops or transfer behavior.
Waveform shape
These records examine the electrical wave itself and preserve distortion or a fast change that a slow trend may hide.
They support decisions about harmonic investigation, switching events, surge protection and equipment compatibility.
Harmonic distortion
Repeating frequency components change the smooth voltage or current wave.
What the record can support
Identify which harmonic orders are present and whether they change with particular loads or operating states.
Transient
A fast impulse or oscillation appears for a short moment.
What the record can support
Correlate the capture with switching, protection operation or a sensitive-equipment trip.
Phase balance and repeated variation
These records compare the three phases or show a variation that repeats across an operating period.
They help direct phase-loading checks, connection inspections and investigations of repeated lighting or equipment behavior.
Voltage unbalance
The three supply phases do not remain at comparable voltage levels.
What the record can support
See which phase differs, when it differs and whether the pattern follows a load or connection condition.
Flicker and repeated voltage change
Small voltage changes repeat often enough to create a visible or operational pattern.
What the record can support
Compare the variation pattern with cycling loads, lighting complaints or recurring production events.
A packaging line kept resetting during refrigeration compressor starts.
A food-processing site experiences two or three unexplained resets each week on one packaging controller. Each reset pauses the line and requires an operator restart. The controller appears normal when technicians inspect it later.
Operators notice that several incidents occur near refrigeration-compressor starts, although many starts complete without a reset. The investigation asks whether a measurable electrical change occurs during the incidents and whether it reaches both systems. A temporary analyser records at the main LV board shared by the refrigeration and packaging feeders across repeated operating cycles. Its clock is aligned with the compressor log, controller alarm history and operator notes.
In the graph, all three traces share the same left-to-right time axis. The olive dashed marker shows the compressor start; the red dashed marker shows the controller reset. The trace heights illustrate the timing relationship and do not represent universal acceptance thresholds.
Shared event record
The three traces use the same time axis. The olive marker shows the compressor start; the red marker shows the controller reset.
Compressor current
Starting demand rises
Supply voltage
Voltage falls and recovers
Controller state
Running state changes to reset
The current rise, voltage sag and reset occurred during the same operating event.
Supported finding
During the recorded incident, compressor current rose, supply voltage sagged and the controller reset. The common time axis provides strong event-to-symptom correlation.
Remaining uncertainty
The main-board record does not locate the source. Supply strength, starting current, phase impedance, connections, protection behavior and controller sensitivity remain candidates.
Immediate follow-up
Compare an upstream record with the affected feeder, review compressor starting current and inspect the relevant connections and controller immunity information. That sequence narrows the investigation before corrective work is selected.
Measurements give corrective work a clearer direction.
The analyser helps a qualified team decide which part of the system deserves closer inspection, which engineering options should be evaluated and which quantities should be checked again after the work.
Each pathway begins with a recorded condition, identifies a possible investigation or corrective direction, and ends with a comparable measurement. The installation and confirmation work still determine which action is appropriate.
Voltage variation
Evidence preserved
Depth, duration, affected phases and timestamp of sags, swells or interruptions.
Investigation or corrective direction
Decide where to compare upstream and feeder measurements, which starts or transfers need closer review, and which equipment immunity information is relevant.
Verification after work
Repeat the same operating condition and compare voltage profile and event recurrence after the selected work.
Harmonic distortion
Evidence preserved
Voltage and current waveform shape, harmonic orders and how they change with the load cycle.
Investigation or corrective direction
Direct a qualified study toward the contributing loads and assess whether filtering, reactors, load separation, equipment selection or derating deserves evaluation.
Verification after work
Compare the same harmonic indicators and operating state after the corrective measure is commissioned.
Phase unbalance
Evidence preserved
The difference between phase levels or currents and the times when the imbalance becomes more pronounced.
Investigation or corrective direction
Prioritize load allocation, connection, conductor and equipment checks at the locations supported by the record.
Verification after work
Confirm that phase values are closer under a comparable operating condition.
Transient events
Evidence preserved
A fast impulse or oscillation with its timestamp, direction and available peak detail.
Investigation or corrective direction
Compare the event with switching records and inspect the relevant protection, earthing and equipment interfaces.
Verification after work
Monitor the same operating window to see whether event frequency or severity changes.
Choose the instrument family from the evidence the investigation needs.
Energy loggers, portable analysers, advanced Class A instruments and permanent monitors overlap, but they do not preserve the same event detail. Sensor kits, transient capture, synchronization, software and communications can change both capability and acquisition cost.
Energy and load loggers
18,000–35,000 MAD
Typical job
Map consumption, demand and load cycles over time.
Record depth
Power, energy, demand and load profiles; event and waveform depth varies by model.
Market examples
Chauvin Arnoux PEL family; comparable load-logging families from Fluke and others.
Portable event and power-quality analysers
30,000–50,000 MAD
Typical job
Investigate recurring sags, swells, interruptions, harmonics, unbalance and site events.
Record depth
Trends, classified events, harmonic summaries and waveform records, depending on model and kit.
Market examples
Chauvin Arnoux Qualistar; Circutor MYeBOX; selected Fluke 1770-series configurations.
Advanced Class A and transient analysers
48,000–85,000+ MAD
Typical job
Support comparable methods, complex investigations and detailed transient or waveform evidence.
Record depth
Class A methods, higher-detail synchronization and transient capture capabilities that vary by instrument.
Market examples
Chauvin Arnoux CA 8345; Fluke 1770-series; Hioki PQ-series; Circutor MYeBOX advanced configurations.
Permanent power-quality monitors
15,000–50,000+ MAD per point
Typical job
Maintain continuous visibility at critical or repeatedly affected measurement points.
Record depth
Long-term trends, events, communications, storage and alarms defined by the installed system.
Market examples
Circutor fixed monitoring families and comparable permanent-monitoring platforms.
July 2026 acquisition reference. Indicative MAD equivalents for hardware, based on approximately 1 EUR = 10.69 MAD. Prices exclude Moroccan VAT, import, transport, sensors, accessories, software, calibration, installation and analysis services. Package contents vary, so a complete campaign kit may exceed the displayed band when current sensors, probes, communications or software are separate. Manufacturer names illustrate recognizable product families and do not rank or endorse individual models.
Class A methods
Useful when comparable methods are needed across instruments, parties, formal assessments or contractual evidence.
Class S methods
Can suit surveys and diagnostic work when the method matches the campaign objective. Placement, context and synchronized records remain essential for either class.
The analyser needs the right leads, current sensors and recording path.
On a typical three-phase low-voltage campaign, the main unit is one part of the field kit. The voltage-reference set represents the selected electrical point, current sensors capture the measured conductors, and the power, storage and export path keeps the evidence usable after the visit.
Package contents vary by model and bundle. Network topology, expected current, conductor access, measurement category and the investigation question determine which accessories complete the job.
Qualified installation boundary. Electrical personnel plan and install the equipment using current manufacturer instructions, the approved site method and the controls required for the selected measurement point. The explanation here omits terminals and live-connection steps.
Typical baseline
What a complete three-phase LV field kit normally contains.
The list defines a practical baseline for a portable campaign. The selected network and measurement purpose may change the conductor count, sensor type or connection accessory.
Analyser and recording path
Main unit, suitable battery or power supply, working memory, and a confirmed export path through storage, USB, network connection or manufacturer software.
Voltage reference set
Compatible voltage leads and clips or probes for the selected network, measurement category and connection method defined by the manufacturer.
Phase-current sensors
Three compatible sensors for the measured phases. A fourth is required when neutral current is part of the investigation. Range, conductor opening and safety rating must suit the site.
Field organization
Phase and channel markers, orderly cable management, secure mounting or support, and a protective case suitable for transport and the planned recording period.
Evidence and documentation
Current firmware, manufacturer connection documentation, calibration status, channel map, time reference and the software or file format needed to review the record.
Package-dependent items
Some jobs and equipment bundles require additional accessories.
Alternative current sensors
Rigid clamps, flexible loops, low-current sensors or leakage-current sensors selected for conductor access, expected current and the quantity being investigated.
Connection and reach options
Fused, magnetic, busbar or specialized probe attachments, extension cables and external power options when the approved method or physical access requires them.
Additional inputs and communications
Auxiliary channels, Wi-Fi, Bluetooth, LTE or remote-transfer modules when other process signals or unattended access need to share the record.
Field support and software
Hard cases, magnetic hangers, mounting straps and additional analysis or reporting licenses when they are not part of the selected package.
Site PPE, controlled access, isolation planning and any required live-work controls remain work prerequisites. They are managed through the site safety method rather than treated as analyser accessories.
Equipment roles
How the measurement chain fits together.
The analyser receives a voltage reference and the selected current-sensor channels at one named boundary. Its power, clock and storage preserve the operating window, and the export path carries the record into review and reporting.
Conceptual measurement chain
The selected measurement point provides a voltage reference and current-sensor channels to the analyser. Power, storage and export complete the record. The drawing explains the equipment roles and omits terminals and live-connection details.
Voltage reference
The compatible lead set represents voltage at the selected point. The manufacturer method defines the required conductors and connection arrangement.
Current sensors
Three solid loops represent phase-current sensors. The dashed neutral loop is included only when neutral current belongs to the investigation.
Power and recording
Stable power, available memory and a synchronized clock keep the relevant operating period intact.
Export and review
The stored configuration and files allow the trend, events, waveforms and harmonic information to be reviewed after capture.
Qualified workflow
From the investigation brief to the first useful analysis.
The sequence shows the decisions and checks around the measurement. The actual installation follows the selected instrument manual and the site electrical-safety procedure.
Define the investigation
Record the symptom, affected asset, operating consequence, selected measurement boundary and the operating cycle most likely to reproduce the event.
The team knows which event it is trying to capture and what the first measurement point can represent.
Match the kit to the site
Confirm network topology, expected voltage and current, sensor count and range, measurement category, power, storage and recorded calibration status.
Every lead, sensor and recording component has a named job in the campaign.
Install under the approved method
Qualified electrical personnel apply the voltage-reference set and corresponding current sensors using the manufacturer diagram, site procedure and required controls.
The installation represents the selected measurement boundary and follows the approved safety method.
Validate the setup
Check phase and channel pairing, sensor direction, selected ranges, labels, clock, time zone, storage, power and whether the live values are plausible for the site.
A configuration error is corrected before it can contaminate the recording period.
Capture the operating event
Begin recording before the relevant operating cycle and preserve operator notes, alarms, starts, transfers, resets and load changes against the analyser clock.
The electrical record and the site event can be compared on the same timeline.
Review and hand over
Inspect the trend, event record, waveform and harmonic information, then export the configuration and evidence and document controlled restoration and equipment removal.
Another competent reader can understand what was captured, how it was obtained and which question remains open.
First useful analysis
The first review checks whether the operating symptom and a measured event share a credible relationship.
The reviewer identifies which phases or quantities changed, when the change occurred and which evidence remains missing. That may support continued recording, a narrower measurement point, an inspection or another test. It does not identify the source from one record alone.
Report excerpt
Another competent reader should be able to reconstruct the finding.
Measurement point
Main LV board
Recorded event
Voltage sag · 14:22:18
Affected operation
Packaging-controller reset
01 · Evidence preserved
Recorded fact
At the main LV board, all three phase voltages fell during the compressor start; phase B reached the deepest point.
Site correlation
The analyser event, compressor operating log and packaging-controller reset share the same timestamp.
02 · Assessment stated
Interpretation
The voltage event provides a credible electrical explanation for the controller reset.
Confidence
Strong event-to-symptom correlation at the recorded measurement point.
03 · Next work defined
Open causes
Supply strength, starting current, phase impedance, connections, protection behavior and controller sensitivity remain candidates.
Follow-up evidence
Compare upstream and feeder measurements, starting-current evidence, inspection findings and the controller immunity information.
Live electrical measurements require qualified personnel, suitable instruments and accessories, an approved method and site-specific controls. The public explanation stays at measurement-chain level and excludes a live connection procedure.
A monitoring proposal should explain the evidence it will leave.
These questions connect the site symptom, instrument choice, measurement boundary and final handover. The answers should be clear before the campaign is commissioned.
- 01
Which site symptom, affected asset and business consequence define the investigation?
- 02
Where will the analyser record, which network topology applies, and what will that point represent?
- 03
Does the quoted kit include the required voltage set, current sensors, power, storage, mounting support, software and calibration record?
- 04
Which operating cycles must occur, and how will the setup be validated before logging?
- 05
Which measurement method, instrument class and output records suit the intended use?
- 06
How will the report separate recorded facts, interpretation, confidence and follow-up?
Questions that shape a credible power-quality campaign.
Existing loggers, permanent monitoring and instrument packages can change the campaign scope. Model capabilities, accessory coverage and the required evidence determine what can be reused and what still needs to be verified.
What a good measurement campaign makes possible.
Power-quality analysers can measure voltage variation, harmonic content, phase balance and short electrical events across the operating period. Suitable sensors, a validated channel setup and a synchronized operating record give owners and technical teams a stronger basis for investigation, corrective decisions and verification.
Establish what happened
Preserve the event type, magnitude, duration, affected phases and timestamp alongside the site operating record.
Narrow the investigation
Compare measurement points and load events to determine which upstream, feeder or equipment checks deserve priority.
Select work using measured evidence
Evaluate inspection, protection, connection, load, filtering or equipment options that match the observed condition.
Verify the result
Repeat a comparable operating condition and check whether voltage quality, phase balance, distortion or event recurrence improved.
The analyser describes the electrical condition at its measurement point. It does not automatically identify or correct the source. Comparison measurements, inspection and additional tests complete the evidence chain and support clearer discussions with equipment suppliers, contractors or the electricity provider.
Have an intermittent electrical event to investigate?
Send the symptom, affected equipment, known timestamps, analyser proposal, event export or previous report. ReneWave can help define the measurement boundary, operating window and evidence the campaign should preserve.
