Maintenance Technology Atlas
    Technology article · Power Quality & Logging

    Electrical Load Logging What a demand profile reveals

    An electrical load logger is a portable recording instrument that measures selected current, power, energy and demand quantities through time. It is used at a main board, feeder or branch circuit to show how electrical loading changes as a site opens, operates, reaches a peak and closes.

    The resulting load profile can expose overnight base load, recurring peaks, exceptional events and the periods when several uses overlap. Those records give capacity, operating and energy studies a measured starting point.

    Demand profileBase load & peaksOperating cycle
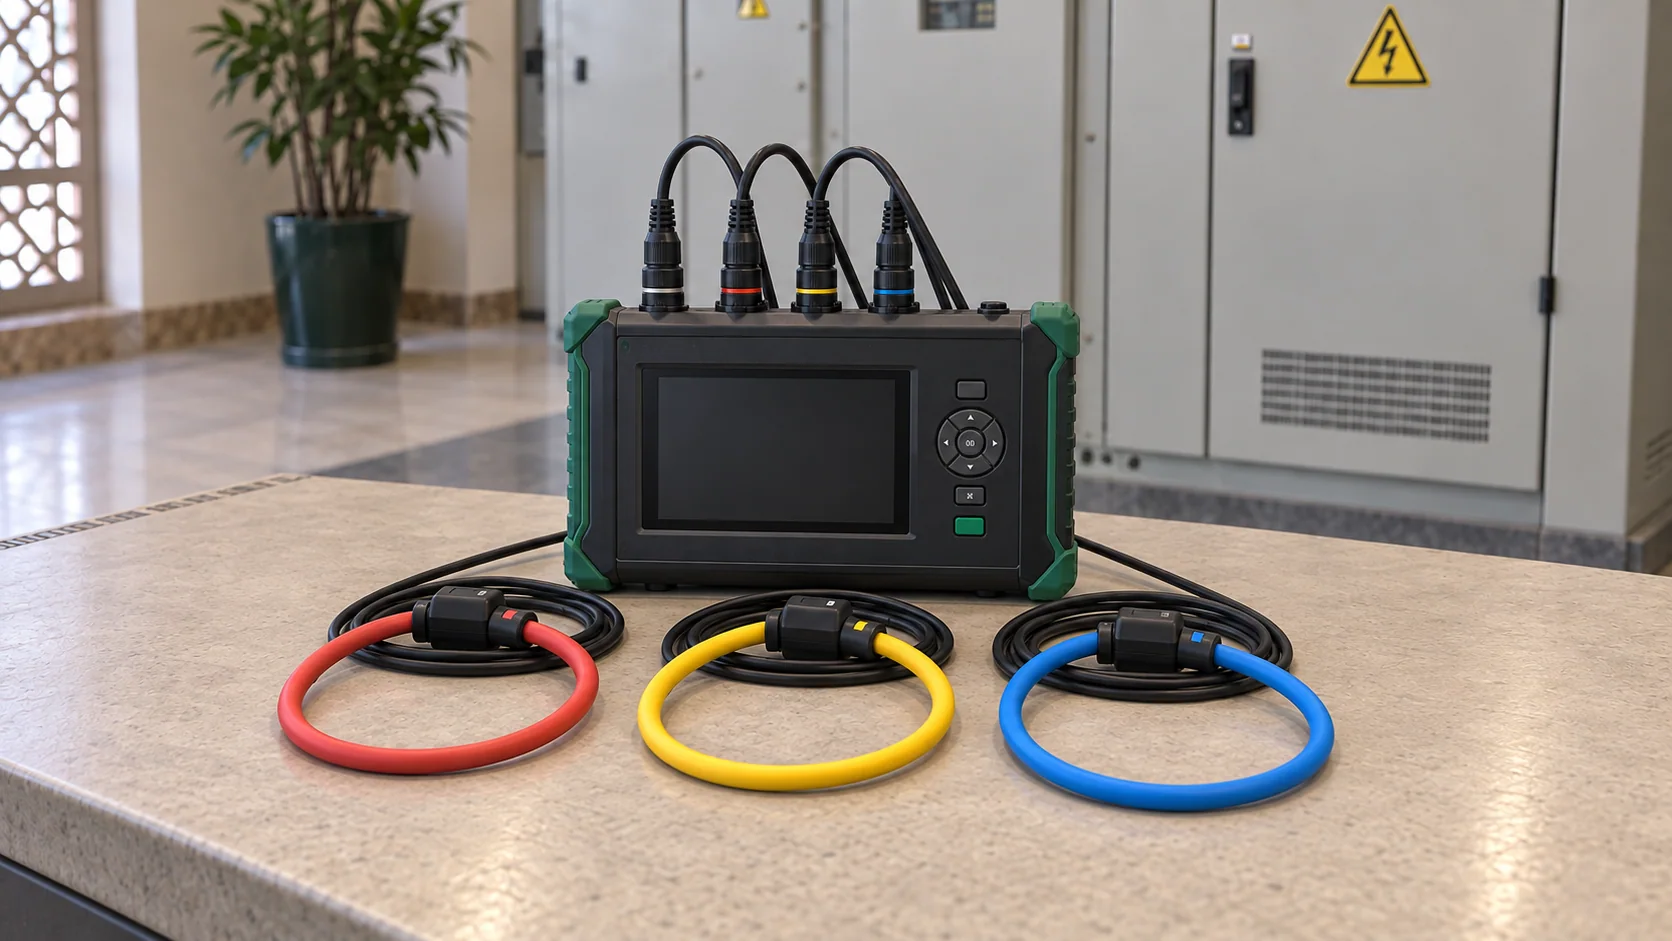
    Centered portable electrical load logger with three current sensors prepared in front of a closed low-voltage cabinet
    Recognition view: a portable recorder and three current sensors prepared for a temporary three-phase load study.
    01 · What it records

    A load profile adds time and operating context to the measurement.

    A clamp reading can confirm the current present during a visit. A temporary logger keeps measuring while the property moves through its normal and exceptional operating states. The report can then separate a level that persists for hours from a peak that lasted for one interval.

    01

    Spot reading

    One measurement moment

    Current or power while the technician is present.

    Useful for checking the condition that exists at that moment.

    02

    Temporary load profile

    A named operating cycle

    Current, power, demand and energy recorded against time.

    Shows recurring peaks, base load, exceptional events and simultaneity.

    03

    Permanent monitoring

    Continuous operation

    Long-term baselines, seasonal change and recurring patterns.

    Supports ongoing energy management after the temporary question is understood.

    Closest neighbouring instrument

    Choose the instrument from the record the decision requires.

    Load loggers and power-quality analysers can use similar voltage leads and current sensors, and some models combine parts of both jobs. Their clearest distinction is the evidence the investigation needs to preserve.

    Electrical load logger

    Demand is rising, a new load is planned, or the site needs to understand when energy is being used.

    A time profile of power, energy, demand, base load, recurring peaks and operating overlap.

    Power-quality analyser

    Equipment resets, lights flicker, protection trips, or a voltage disturbance is suspected.

    Voltage-quality trends, event timestamps, duration, affected phases, waveform detail and harmonic evidence, depending on the model.

    A site can need both records. Before commissioning, confirm whether one advanced instrument, its sensors and its software can capture the required load profile and disturbance evidence, or whether coordinated measurements are needed.

    Current (A)

    The electrical current passing through each measured phase or circuit.

    Checks loading and phase behavior. Current alone does not provide verified active power or energy.

    Active power (kW)

    The rate at which the measured loads are using electrical energy at that time.

    Shows the operating demand that matters for capacity, load overlap and many energy decisions.

    Energy (kWh)

    Active power accumulated through the recording period.

    Connects the shape of the profile to total consumption over a shift, day or campaign.

    Demand

    Power summarized over a defined interval rather than a single instant.

    Makes the selected averaging interval part of the result and part of the report.

    Power factor

    A relationship between active power and the apparent electrical loading of the supply.

    Adds context when current and available electrical capacity do not move in the same proportion.

    IEC 61557-12 covers power metering and monitoring devices used in industrial and commercial electrical distribution systems. Instrument function and performance still need to match the selected measurement purpose. IEC 61557-12:2018

    02 · Reading a load profile

    The curve shows how much power the site used and when it used it.

    Read from left to right. Time runs along the horizontal axis. Active power in kilowatts runs up the vertical axis. The green line follows the measured demand through the day, while the shaded area represents power sustained through time and therefore contributes to energy use.

    Illustrative twenty-four-hour electrical load profileActive power rises from an overnight base load to a recurring afternoon peak as more parts of a mixed-use commercial property operate together.010020000:0006:0012:0018:0024:00Active power (kW)Time through the operating dayBASE LOAD
    Illustrative profile. The graph shows active power against time; it does not represent a universal limit, tariff interval or acceptable capacity margin.

    Base load

    The overnight level that remains after most tenants and shared services have reduced operation.

    Operating ramp

    The morning rise as offices, retail areas, ventilation, lifts and food-service loads enter operation.

    Recurring peak

    The afternoon overlap that appears repeatedly under comparable occupancy and weather conditions.

    Energy through the day

    The area under the power curve accumulates into energy. A brief peak and a long plateau can affect different decisions.

    03 · Interval and campaign window

    The recording interval changes which parts of a peak remain visible.

    Loggers summarize measurements over selected intervals. A short interval can preserve a brief operating peak. A longer average may describe sustained demand more clearly while smoothing that short change. The campaign records both the interval and the operating question it was selected to answer.

    One-minute averages

    The short peak remains visible.

    0100200Active power (kW)Same illustrative operating event

    Fifteen-minute averages

    The same event appears as a lower average.

    0100200Active power (kW)Same illustrative operating event
    Illustrative comparison. The values show the effect of aggregation on one event. They do not define a utility billing interval, equipment limit or universal campaign setting.
    01

    Named operating condition

    The campaign identifies the occupancy, production, weather, deliveries, tenant activity or equipment state that the result is meant to represent.

    02

    Expected recurrence

    The recording window covers the shift, weekday, weekend, seasonal condition or exceptional event needed to answer the investigation question.

    03

    Shared time reference

    Logger time, operator notes, alarms and building or tenant records use a consistent clock so profile changes can be interpreted.

    04

    Recorded gaps and changes

    Power loss, sensor movement, missing data and changes to normal operation remain visible in the campaign record.

    04 · Mixed-use site example

    A commercial property needed to understand its recurring peak before adding a tenant.

    The property included offices, retail units, shared cooling, lifts and a food-service tenant. Electricity bills showed rising demand, but the owner could not tell whether the highest value represented normal overlap or one unusual day. A temporary logger at the main LV board recorded a representative week while the site team preserved opening hours, cooling schedules, deliveries and tenant activity against the logger clock.

    00–06
    06–09
    09–12
    12–17
    17–24
    Monday
    Tuesday
    Wednesday
    Thursday
    Friday
    Saturday
    Sunday
    LowerHigher
    Illustrative weekly heatmap. Darker cells show higher relative demand. Thursday afternoon contains one exceptional event above the recurring weekday pattern.

    Recurring evidence

    Weekday afternoons repeatedly carried the highest ordinary demand as cooling, retail and food-service activity overlapped.

    Exceptional evidence

    Thursday rose above the recurring band. The operating diary identified an exceptional tenant event that should remain separate from the normal design case.

    Next boundary

    The main-board record showed when to investigate. A targeted feeder measurement was still needed before assigning the afternoon contribution to a specific tenant or shared service.

    05 · Decisions supported by the profile

    Measured operating patterns give capacity and energy decisions a firmer basis.

    The profile becomes useful when it changes a practical decision. Recorded evidence can narrow the work that deserves evaluation and preserve a way to check the result under comparable conditions.

    01

    Capacity and expansion

    Recurring maximum demand, phase loading and the operating conditions present at the peak.

    Decision or investigation

    Use the measured profile in the electrical study for a new tenant, process load, charger, cooling plant or other expansion.

    Verification

    Repeat the relevant operating condition after the change and compare demand at the same boundary.

    02

    Base load and operating schedules

    Demand that remains overnight, during closure or outside the expected production window.

    Decision or investigation

    Target a branch measurement, control review or site inspection around the loads that should have reduced operation.

    Verification

    Compare the same off-hours window after schedules, controls or operating practices are adjusted.

    03

    Peak overlap and load management

    Repeated periods when several major uses operate at the same time.

    Decision or investigation

    Evaluate sequencing, setpoint coordination or non-critical load shifting with the affected operators.

    Verification

    Confirm that the profile changed without moving the same operating problem to another period.

    04

    Solar, storage and energy projects

    The timing and persistence of daytime demand and the difference between ordinary and exceptional days.

    Decision or investigation

    Use the profile as one input to self-consumption, battery dispatch or energy-efficiency studies.

    Verification

    Preserve a comparable baseline and account for occupancy, weather and operating changes when results are reviewed.

    A main-board profile shows the combined demand crossing that boundary. It cannot identify every appliance or prove responsibility for a peak. Operating records, branch measurements and inspection provide the missing detail.

    06 · Choosing a logger

    Choose the logger family from the quantities and operating window the decision needs.

    Portable products overlap. Some current-only loggers are deliberately narrow. Power and energy loggers add voltage references and calculated quantities. Advanced units may include remote transfer, harmonics or auxiliary inputs. The exact model, sensors and software determine the usable package.

    Current-only logger

    Circuit loading or feeder-current studies where voltage, active power and energy are outside the question.

    Evidence: Current trend, phase values and selected minimum or maximum records, depending on the model.

    A simpler setup can answer a loading question. It cannot produce verified kW or kWh from current alone.

    Three-phase power and energy logger

    Capacity studies, energy audits, operating profiles and demand investigations.

    Evidence: Voltage, current, active power, energy, power factor and interval demand.

    The usual starting family when the decision depends on both electrical loading and energy use.

    Advanced portable logger

    Campaigns needing remote transfer, additional inputs, longer unattended operation or selected harmonic context.

    Evidence: Load profile plus model-dependent communications, event, harmonic or auxiliary-channel functions.

    Extra capability has value when it serves the campaign. Product-family boundaries overlap, so the exact model still needs checking.

    Permanent monitor

    Sites that need continuous baselines, allocation or recurring operational visibility.

    Evidence: Long-term meter data from fixed measurement points and a maintained data platform.

    A temporary logger can establish the monitoring question before a permanent architecture is specified.

    July 2026 acquisition context

    Hardware price depends heavily on sensors and package contents.

    Rounded indicative equivalents use approximately 1 EUR = 10.68 MAD. Professional campaign pricing remains separate from instrument acquisition.

    Compact logger body or basic package

    Sensor contents and communications vary.

    14,000–28,000 MAD

    Complete professional three-phase kit

    Suitable current sensors and working accessories included.

    32,000–55,000+ MAD

    Indicative hardware equivalents exclude Moroccan VAT, import, transport, installation, analysis services and, where absent from the package, current sensors, voltage accessories, software, communications and calibration. Market examples include Chauvin Arnoux PEL 100, Fluke 1732/1734, Hioki PW3360/PW3365 and Circutor MYeBOX families. Capabilities vary by exact model. Fluke 1732/1734 · Hioki PW3360 · Chauvin Arnoux PEL 100 · Circutor MYeBOX

    07 · Complete kit and qualified campaign

    The campaign dossier connects the business question to the recorded profile.

    A useful job records the measurement boundary, quantities, interval, operating window and complete equipment package before installation. Qualified personnel then apply the selected manufacturer method and site controls, validate the channels, preserve operating notes and restore the installation after removal.

    Illustrative campaign brief
    Question
    Recurring peak and remaining capacity before a new tenant is connected.
    Boundary
    Main LV board serving the complete mixed-use property.
    Quantities
    Phase current, voltage, active power, energy, power factor and demand.
    Operating window
    Representative occupied weekdays, weekend operation and identified exceptional events.
    Time basis
    Logger, operator notes and building or tenant records aligned to one clock.
    First follow-up
    Targeted feeder logging if the main profile cannot separate shared and tenant contributions.
    Typical three-phase LV working kit
    01

    Recorder, power and memory

    The logger main unit, suitable power or battery arrangement, working storage and a confirmed export route.

    02

    Voltage-reference set

    Compatible voltage leads are required when the job needs active power, energy, power factor or voltage context. A current-only study has a narrower output.

    03

    Current sensors

    Three compatible phase sensors for the typical three-phase LV case, selected for conductor access, expected range, accuracy and safety category.

    04

    Field control and records

    Channel markers, secure support, current firmware, manufacturer documentation, calibration status, synchronized time and the analysis software or file format.

    Neutral-current sensing, extra branch channels, flexible probes, remote communications and advanced software are scope- and package-dependent. PPE, controlled access, isolation planning and live-work controls are site-safety prerequisites rather than logger accessories.

    Qualified campaign calendar
    01

    Brief and prepare

    Name the business question, measurement boundary, quantities, operating cycle, interval logic and report output before equipment is selected.

    02

    Install and validate

    Qualified personnel follow the selected manufacturer and site method, then verify channels, sensor direction, ranges, clock, power, storage and plausible values.

    03

    Record operation

    Capture the agreed operating window while operator notes, tenant activity, starts, closures and exceptional events share the same time reference.

    04

    Review and restore

    Export the profile and configuration, identify usable and missing evidence, document restoration, and define any branch measurement or repeat campaign.

    First useful analysis

    The first review should separate recurring base and peak behavior from exceptional events.

    It should also show which phases or quantities changed, whether the recorded operating window represents the business question, and whether the next step is longer recording, a different season, a narrower feeder boundary, inspection or permanent monitoring. One main-board profile does not identify individual loads by itself.

    This owner/operator explanation describes campaign purpose and evidence. It omits terminal-level connection details. Live electrical measurements require qualified personnel, suitable equipment, current manufacturer instructions and site-specific controls.

    08 · Report and review

    Another competent reader should be able to reconstruct the load study.

    A screenshot of the highest value is incomplete. The report preserves how the profile was acquired, which operating conditions it represents, how recurring and exceptional demand were separated, and which decision the evidence can support.

    01

    Instrument record

    Logger model, firmware, sensor models and ranges, calibration status and software version.

    02

    Measurement boundary

    One-line reference, point of connection, network topology, channel map and quantities recorded.

    03

    Acquisition record

    Start and finish, interval, demand period, time zone, power source, storage and any missing data.

    04

    Operating context

    Occupancy, tenant activity, schedules, weather or production state, alarms and exceptional events.

    05

    Results

    Load profile, base load, recurring and exceptional peaks, energy, phase observations and clearly labelled illustrative or measured values.

    06

    Assessment

    Interpretation, confidence, limitations, next measurement and the decision the evidence can support.

    Before commissioning

    Six questions keep the campaign connected to the decision.

    01

    Which business or operating decision is the logging campaign expected to improve?

    02

    Which main board, feeder or branch circuit defines the measurement boundary?

    03

    Which quantities, channels, averaging interval and demand interval will be recorded?

    04

    Which operating days, tenant conditions or exceptional events must the campaign represent?

    05

    Does the proposed kit include suitable sensors, voltage leads, power, storage, software and calibration evidence?

    06

    Will the handover include the configuration, raw export, profile, operating notes, limitations and recommended follow-up?

    FAQ · Practical decisions

    Questions that shape a useful load study.

    Existing instruments, utility data and the selected measurement boundary can change the campaign. Timing, resolution, export access and operating context determine whether the available record is sufficient or another measurement is needed.

    It can when the exact model, sensors and software record the required three-phase power, energy, interval demand and operating profile. Separate instruments are unnecessary when one complete kit preserves every required output.

    It may reduce additional measurement when the available interval data has adequate timing, resolution, export access and the correct measurement boundary. Monthly bills or demand summaries usually lack operating context and feeder detail.

    Duration follows the operating cycle and recurrence being studied. The record must include representative occupied periods, closures, weekends, shifts, seasonal conditions or exceptional events relevant to the decision.

    It shows when the total changed. Attribution requires operating records, existing submeters or a targeted feeder-level follow-up.

    It supplies measured demand evidence, while the final capacity assessment must also consider phase loading, conductors, protection, transformer or supply limits, operating conditions and applicable design requirements.

    It is an important input for self-consumption and dispatch studies. Solar resource, tariff structure, usable surface, system losses, storage objective and operating changes remain separate inputs.
    Conclusion

    What a credible load profile makes possible.

    Electrical load logging gives owners and operators a time-based record of how a site actually uses electrical capacity. It can distinguish persistent base load from short and sustained peaks, show which periods deserve closer investigation, and provide measured evidence for expansion, scheduling, energy-efficiency, solar or storage studies.

    The profile guides the next decision and provides a baseline for verification. Source attribution still depends on the measurement boundary, operating records, selective branch measurements and inspection.

    Reveal

    Base load, recurring peaks, exceptional events and periods of load overlap.

    Guide

    Capacity studies, operating changes, targeted feeder measurements and energy-project design.

    Verify

    Repeat the same boundary and comparable operating condition after the selected change.

    Preserve

    Configuration, interval, operating context, raw export, interpretation and limitations.

    Maintenance technology

    Have a load profile or logger proposal to review?

    Send the measurement brief, one-line diagram, logger proposal, raw export or existing report. ReneWave can explain what the profile shows, which operating context is missing and what the next measurement should resolve.

    ReneWave markRENEWAVE

    Energy systems, held to standard.